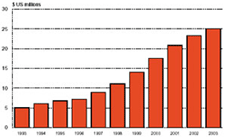
 |
The liberalization
process in India started 5 years back, with consistent
reforms during this phase, the Indian economy is expected
to achieve a growth of about 9 % this financial year.
India is one of the fastest growing
economies in the world and by the year 2020 it is expected
to be the third largest economy after the United States
and China.
|
|
The GDP per capita (at
purchasing power parity) is also expected to jump during
this period from approximately USD 3100 to USD 5000.
This along with the fact that a majority of the population
would be in the working age group by 2020, would lead
to not only a larger but also a richer consumer base,
making it one of the most attractive markets in the
world.
| Year GDP |
Growth
|
Forex
|
FII
Flow |
FDI
|
Per
Capita |
Inflation |
| 1990 |
4.9 % |
USD
1 bn |
USD
1 million (1993) |
USD
97 million |
USD
390 |
9% |
| 2008 |
8.7
% |
USD
309 bn as on Mar 28, 2008 |
USD
16.1 bn in 2007-08 |
USD20.10bn
in 2007-08 till Feb. |
USD
740 7 |
.4
% as on March29, 2008 |
|
|
The industrial growth
at current prices in the financial year 2007-08 reached
10.7 %, service industry grew by 8.9% & agriculture
at 5.6 %.
|
|

|
|
India's foreign exchange reserves increased
by 55 % in 2007-08 to $309.16 billion, which is an increase
of nearly $110 billion from $199.18 billion at the end
of 2006-07.
Indian exports show a growth of 23.02
% to $155.51 billion in 2007-08 as against $126.41 billion
in 2006-07. On the other hand, India's import increased
to $235.91 billion in 2007-08 as against $185.73 billion
in 2006-07 showing growth rate of 27.01%. The trade
deficit is soared to an estimated value of $80.39 billion
in 2007-08 against $59.32 billion in 2006-07 which is
due to increase in oil imports that went up by 38.25
%.
|
| Foreign
Direct Investment |
|
India has emerged as the second hottest
FDI destination in the world, next to China, but ahead
of Russia and Brazil. World Investment Prospects for
2007-09 has said that India and China are attractive
nations due to large size and growth of domestic markets
along with cheap labour.
|
| The sector
wise GDP growth rates (at constant prices) for the second
quarter of 2005-06 are as follows: |
| INDUSTRY SECTOR |
| Financial Year |
Total FDI Equity Capital Flow
(US $ billion) |
| 1991 (Aug) - 2000 (March) |
15.48 |
| 2000-01 |
2.91 |
| 2001-02 |
4.09 |
| 2002-03 |
2.69 |
| 2003-04 |
2.51 |
| 2004-05 |
3.77 |
| 2005-06 |
5.97 |
| 2006-07 (P) |
16.47 |
| 2007-08 (April-Feb) |
20.10 |
| (Source - Department
of Industrial policy and Promotion, P = Provisional
Data) |
|
|
Challenges in front of Indian economy
|
- Sustaining and achieving GDP of 8-9 % in next 5
years.
- Allowing foreign direct investment in more sectors
so as to maintain the growth rate.
- Giving prime importance to infrastructure development
and attract FDI in this sector.
- Keeping population under control so that everyone
can satisfy their basic needs.
- Boosting agricultural growth.
- Improving educational & healthcare facilities.
- Simplifying procedures and relaxing entry barriers
for business coming from outside the nation.
|